LaTeX Tools
Example
from econtools import read, outreg, table_statrow, write_notes
import econtools.metrics as mt

# Load data
df = read('my_data.dta')

# Run Regressions
reg1 = mt.reg(df, 'ln_wage', ['ed'], addcons=True)
reg2 = mt.reg(df, 'ln_wage', ['age', 'age2'], addcons=True)

# Put coefficients and standard errors in a table
regs = (reg1, reg2)
table_string = outreg(regs,
                      ['ed', 'age', 'age2', '_cons'],     # Add these coefficients to the table
                      ['Years Education',                 # Use these label for the coeffs
                       'Age',
                       'Age$^2$',
                       'Constant']
                      digits=3                            # Round to 3 decimal digits.
                      )

# Add R^2 to the table
table_string += "\\\\ \n"                           # Empty line between betas and r2
table_string += table_statrow("R$^2$"               # Add a row with this label
                              [x.r2 for x in regs], # Fill the row with these values
                              digits=3)

# Save the table string to a file
results_path = 'my_results.tex'
with open(results_path) as f:
    f.write(table_string)

# Save separate file with table notes
notes = "Sample size is {}.".format(reg1.N)
write_notes(notes, results_path)
The above snippet of code saves two files to disk, my_results.tex:
Years Education  & 3.142**    &             \\
                 & (1.413)    &             \\
Age              &            & 1.590       \\
                 &            & (2.020)     \\
Age$^2$          &            & 1.390       \\
                 &            & (4.024)     \\
Constant         & 11.132***  & 10.324***   \\
                 & (1.324)    & (2.720)     \\
\\
R$^2$            & 0.129      & 0.132       \\
and my_results_notes.tex:
Sample size is 934.
These files can be incorporated into a LaTeX document using the \input
command. In the main LaTeX document:
\documentclass{article}

\usepackage{threeparttable}
\usepackage{booktabs}

\begin{document}

\begin{table}
    \centering
    \caption{Two Wage Regressions}\label{tab:wage-reg}
    \begin{threeparttable}
    \begin{tabular}{lcc}
        \toprule
         & (1) & (2) \\
        \midrule
        \input{my_results}  % The table fragment
        \bottomrule
    \end{tabular}
    \begin{tablenotes}
        \item \emph{Notes:}
            \input{my_results_notes}  % The note on sample size.
    \end{tablenotes}
    \end{threeparttable}
\end{table}

\end{document}
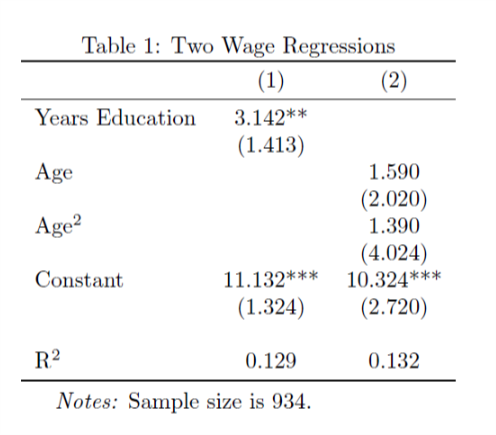
This results in