by Daniel M. Sullivan and Alan Krupnick
January 2019
Download Paper 
Abstract From Paper
Compliance with the Clean Air Act’s National Ambient Air Quality Standards (NAAQS) is determined using local pollution monitors. However, most counties have zero or one monitor, and monitors may not represent exposure across wide areas. We use satellite-derived data on fine particulate matter (PM2.5) to revisit the compliance determinations for the PM2.5 annual NAAQS made in 2015. Mirroring current regulatory practice, we flag counties as “nonattainment” if they contain areas that exceed the NAAQS. Comparing the satellite-based list of nonattainment areas to the official determinations, we estimate that 24.4 million people live in attainment areas that the satellite data suggest should be nonattainment. We then estimate how air quality changes in areas targeted by regulators for improvement, as occurs around ground-based monitors that are designated nonattainment. The estimates suggest that proper classification would have prevented 5,652 premature deaths between 2016 and 2017, a welfare gain of $51 billion.
Summary
EPA relies on a limited network of monitors
The Clean Air Act (CAA) establishes National Ambient Air Quality Standards (NAAQS). Jurisdictions (e.g., counties) whose air pollution levels exceed the NAAQS can be classified as "nonattainment" with the CAA which increases the regulatory scrutiny on polluters in the area. Abundant research has shown that giving a county nonattainment status subsequently improves air quality and associated health outcomes.
A county's attainment with the NAAQS is assessed using stationary air pollution monitors located within the county. Counties that are not monitored are very unlikely to ever receive a nonattainment designation.
However, these monitors are expensive to produce and operate, and roughly 80% of counties in the U.S. (comprising 37% of the population) do not have a monitor for Fine Particulate Matter (PM2.5). PM2.5 has been shown to contribute to a number of health problems, including dementia and Alzheimer's.
Is is possible that many areas have pollution exceeding the national standards that is undetected because of a lack of monitors?
Satellite data can fill gaps in the monitor network
Satellite-based instruments can measure ground-level particulates across the entire United States. The map below compares the NAAQS to the three-year annual average of satellite-based PM2.5 readings for 2012-2014 for every square kilometer of the continental US. (The three-average for this period is the "design value", or relevant statistic, used to assess compliance with the most recent revision to the NAAQS implemented in 2015.)
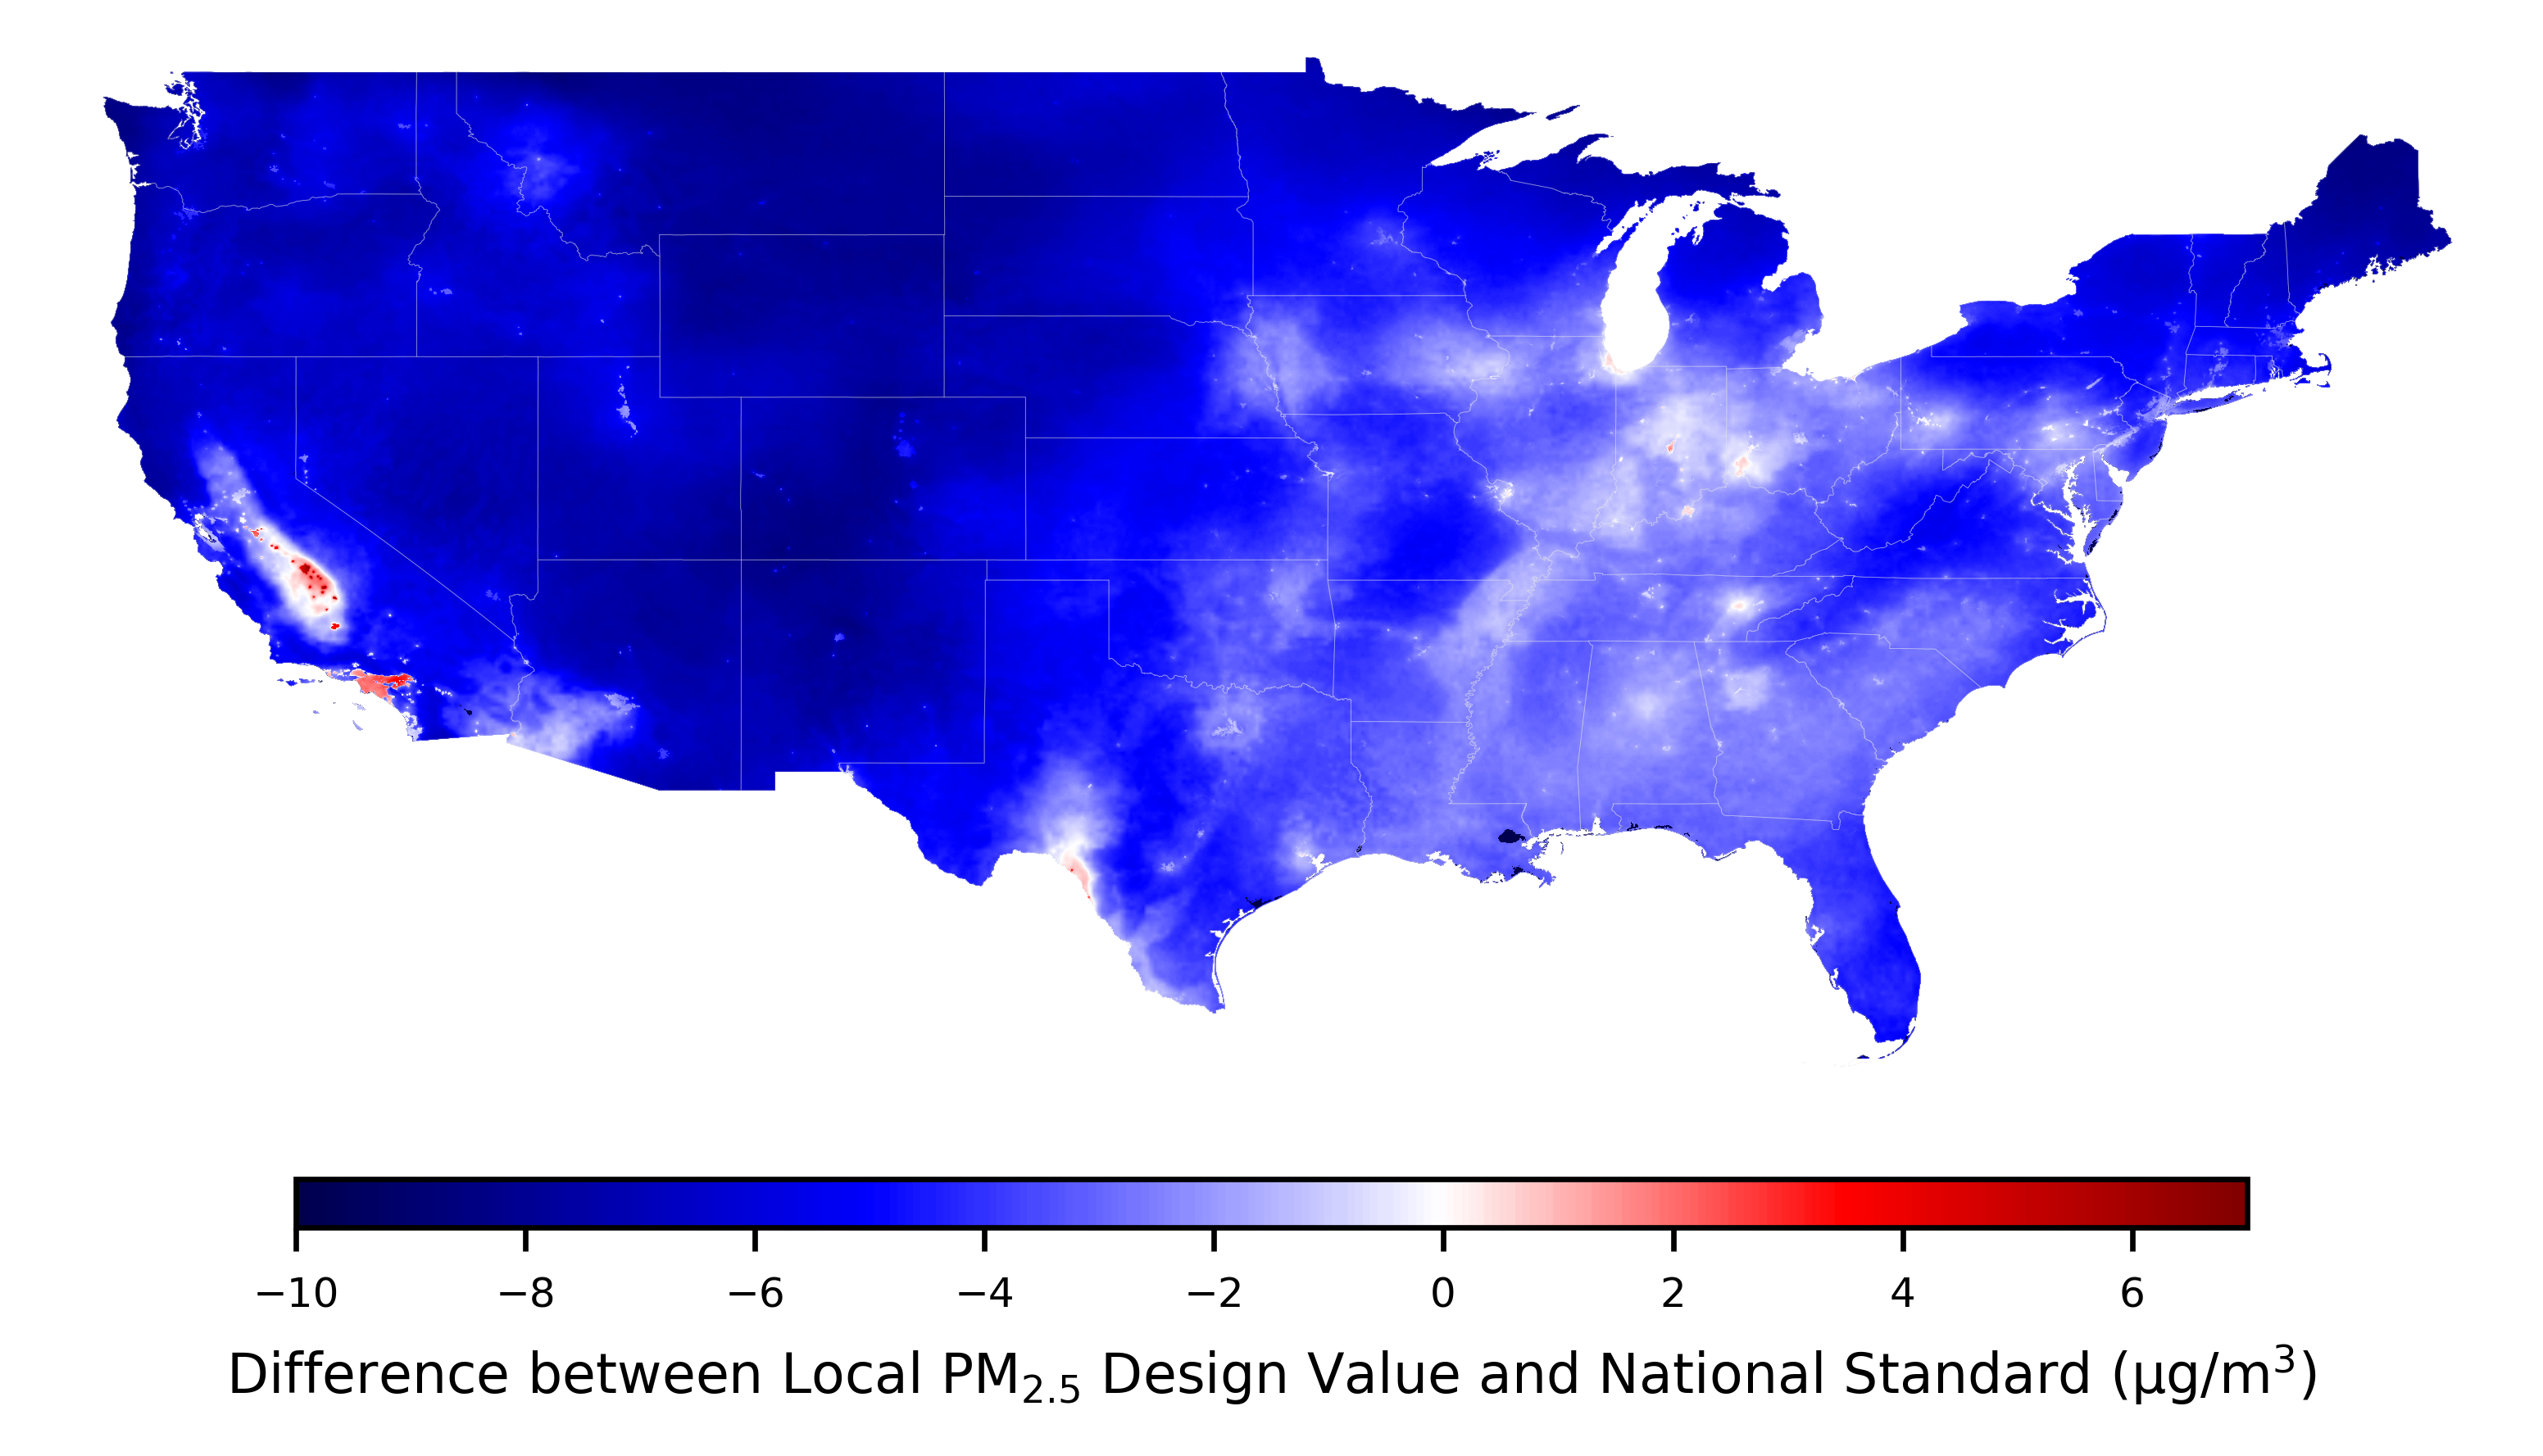
Areas in red exceed the NAAQS, areas in white are on the cusp of exceeding, and areas in blue are in compliance.
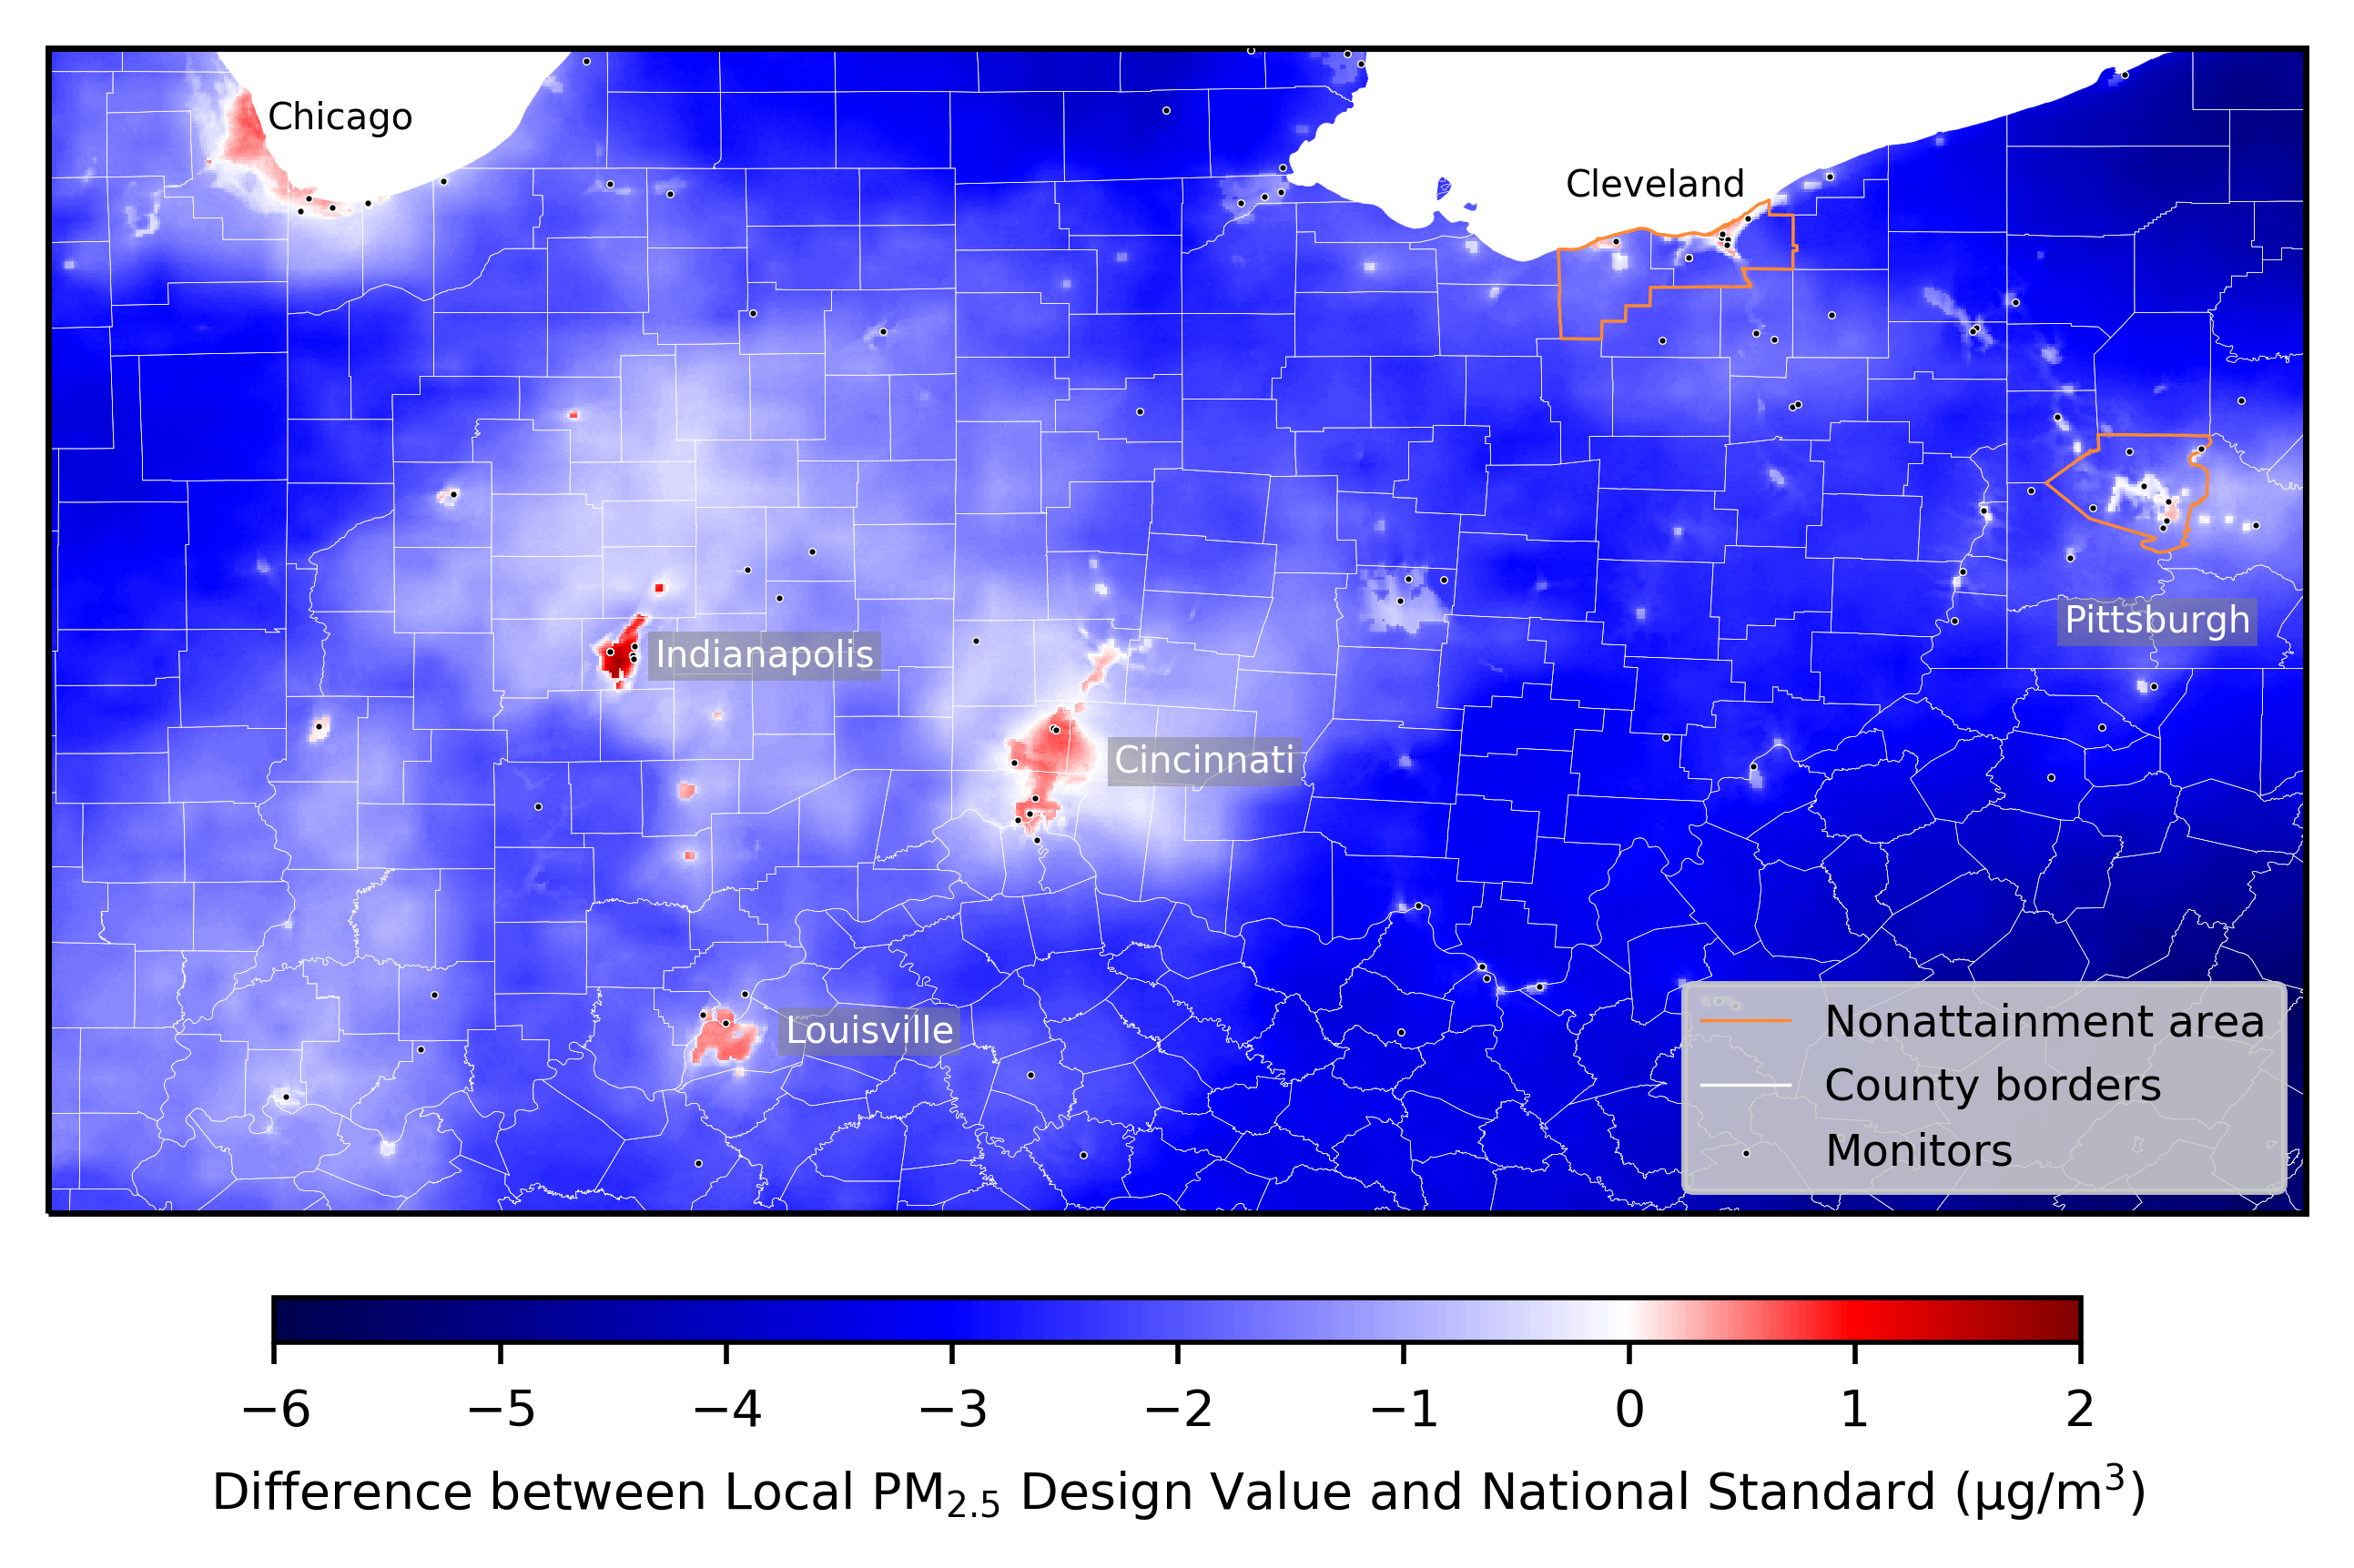
Zooming in on the mid-west shows how many pollution hotspots lack monitors, how monitors are often placed outside local hot spots, and that there are many areas over the NAAQS not covered by nonattainment areas. We refer to these areas as "misclassified" because EPA rules suggest the areas should be classed nonattainment but they are officially classed attainment.
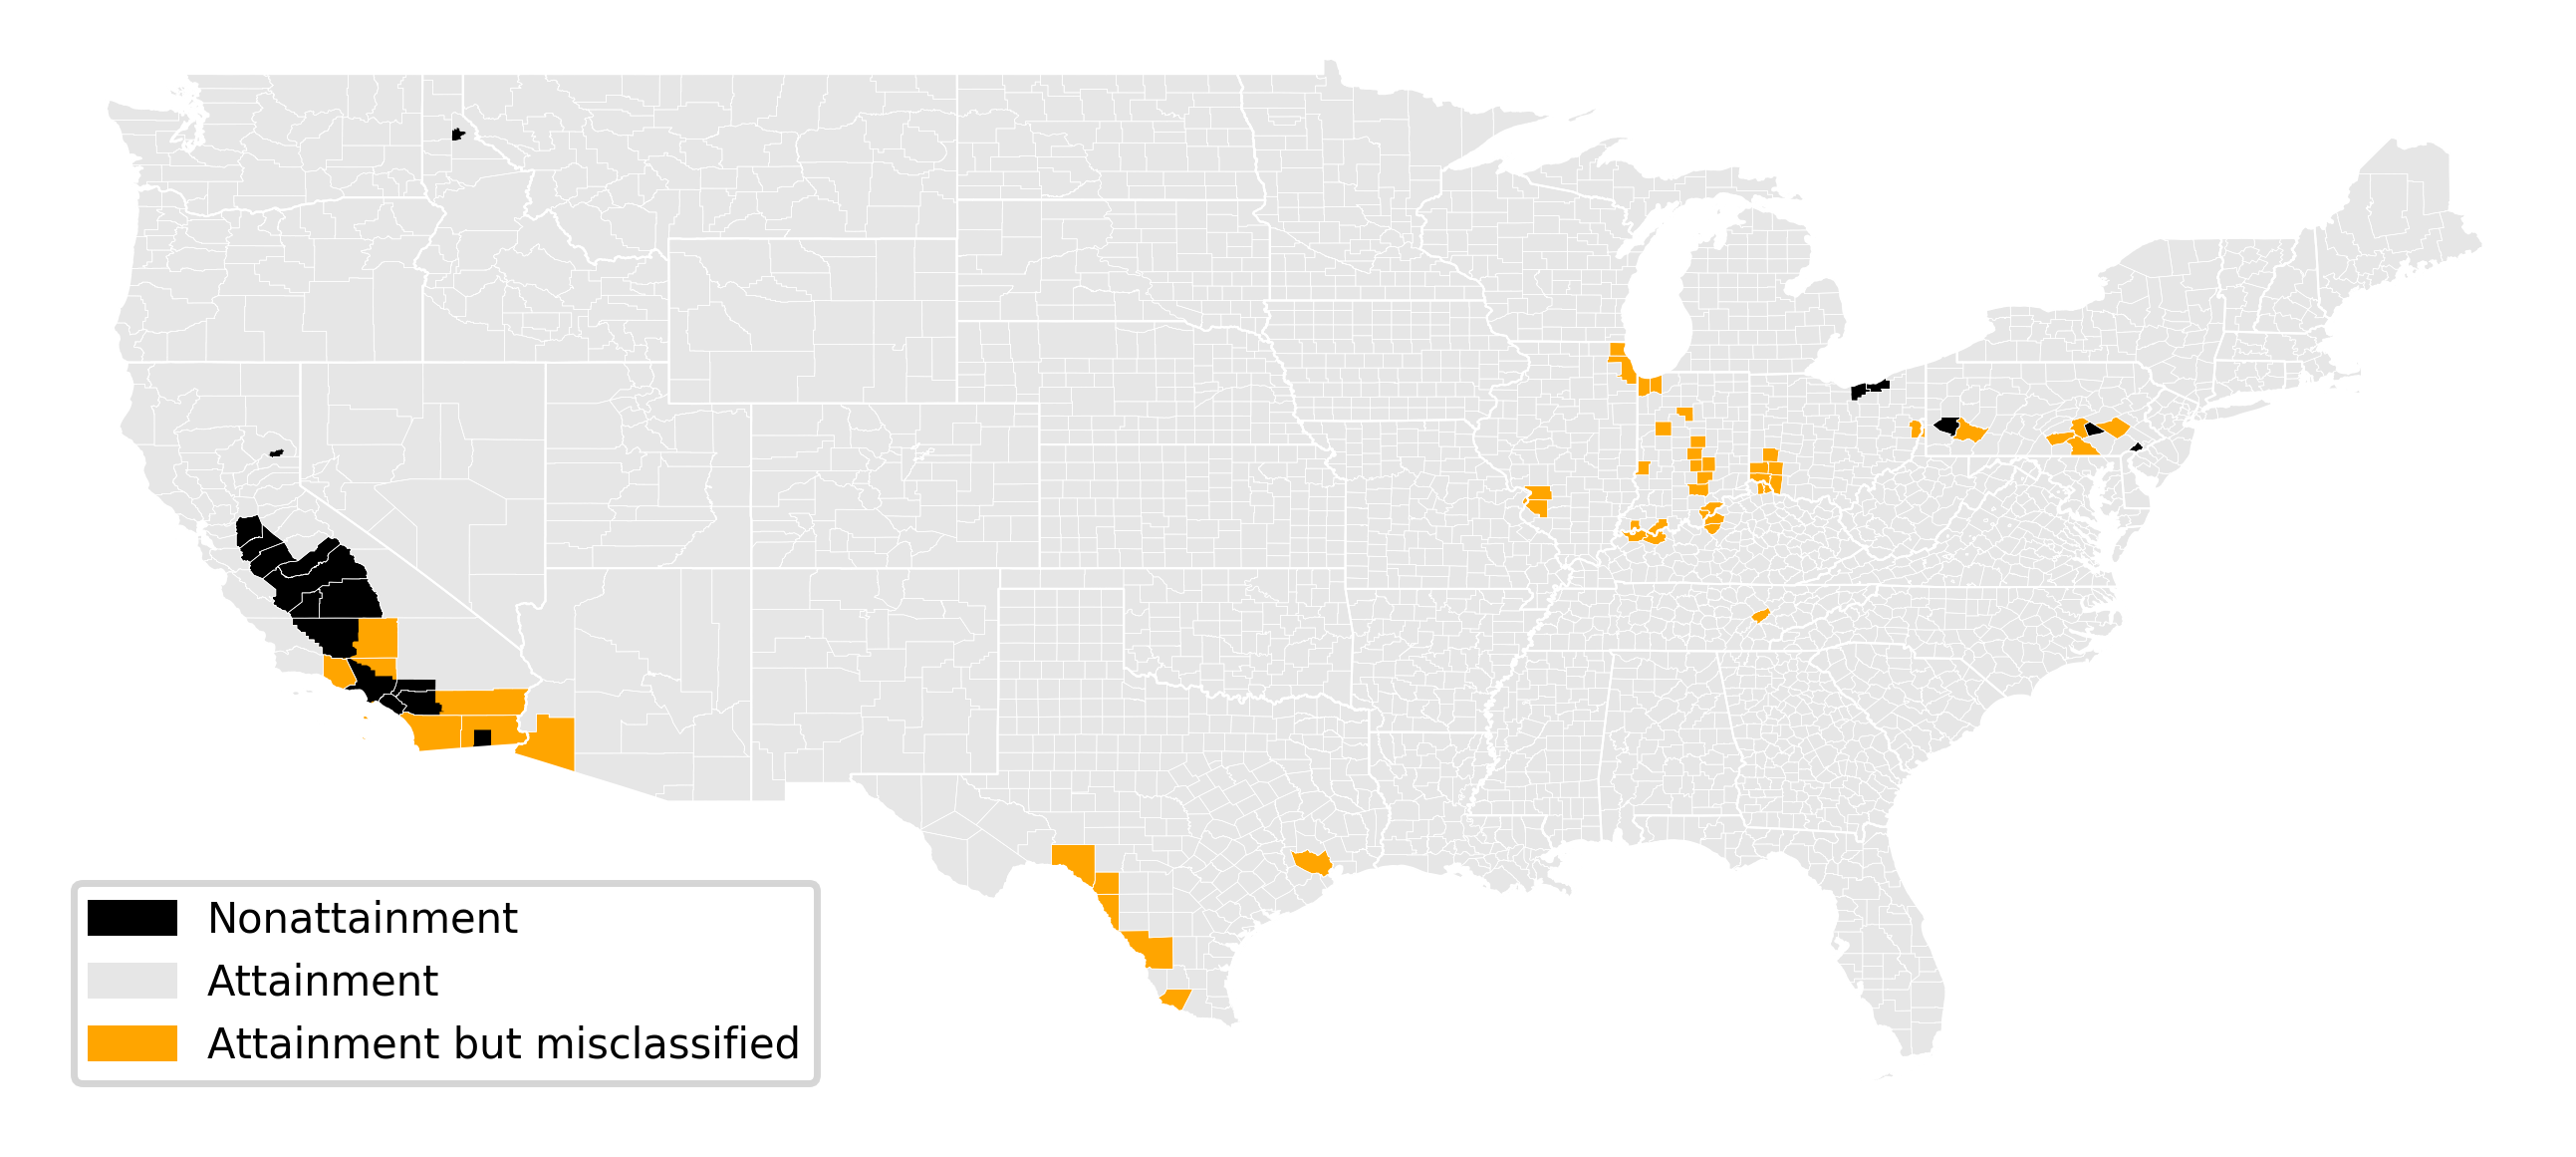
Monitors miss half the people living in NAAQS-exceeding areas
Misclassified Counties vs Nonattainment Counties
Misclassified Population by State
| State | Counties with no Monitor | Counties with at least 1 monitor | Total |
|---|---|---|---|
| West Virginia | 0 | 24,069 | 24,069 |
| Tennessee | 0 | 54,181 | 54,181 |
| Arizona | 0 | 195,751 | 195,751 |
| Missouri | 0 | 319,294 | 319,294 |
| Kentucky | 975,135 | 233,242 | 1,208,377 |
| Pennsylvania | 633,269 | 1,081,820 | 1,715,089 |
| Ohio | 945,497 | 1,240,213 | 2,185,710 |
| Indiana | 616,795 | 2,229,834 | 2,846,629 |
| Texas | 418,007 | 4,092,459 | 4,510,466 |
| California | 844,427 | 4,059,633 | 4,904,060 |
| Illinois | 6,437,475 | 0 | 6,437,475 |
| Total | 10,870,605 | 13,530,496 | 24,401,101 |
Misclassification costs billions in increased mortality
Nonattainment status brings cleaner air and attending health benefits. The last time nonattainment designations were made for the PM2.5 annual NAAQS was 2015. What if all misclassified counties had been made nonattainment? We estimate the improvement in air pollution that would have hypothetically occurred in a number of ways. We then use the value of decreased mortality risk (or value of statistical life) to calculate the dollar value of cleaner air to county residents.
Our most realistic estimate of air quality improvement would have been worth about $51 billion during 2016-2017, while our most conservative estimate yields a worth of $5 billion for the same period. These values only account for the benefit of decreased mortality and not morbidity effects like asthma, COPD, and other lung disorders, or decreased productivity and missed days of work or school.